Linux Performance Monitoring And Find Statistic Of Process Using Pidstat
![]()
Pidstat use for monitoring system or individual task currently being managed by linux kernel. Usually pidstat was built-in in linux system, but you can install it if not available. Pidstat can also for monitoring child process of selected task.
####
Here For Installation Pidstat (if not available)
For Ubuntu/Debian
1
$ sudo apt-get install sysstat
For Fedora, CentOs (redhat based)
1
$ sudo yum install sysstat
Using Pidstat
The simple command for running pidstat, just type pidstat command in terminal (Gnome) or konsole (KDE).
1
$ pidstat
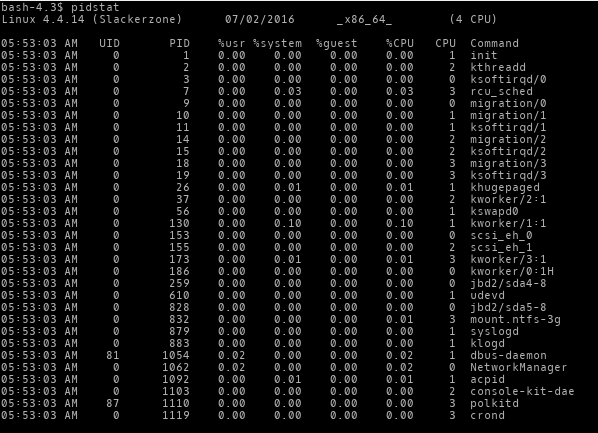
In the output explain:
PID - The identification number of the task being monitored.
%usr - Percentage of CPU used by task while executing at the user level (application), with or without nice priority.
%system - Percentage of CPU used by the task while executing at the system level.
%guest - Percentage of CPU spent by the task in virtual machine (running a virtual processor).
%CPU - Total percentage of CPU time used by the task. In an SMP environment, the task’s CPU usage will be divided by the total number of CPU’s if option -I has been entered on the command line.
CPU - Processor number to which the task is attached.
Command - The command name of the task.
I/O Statistic
You can use I/O statistic about process using -d options, with following command:
1
$ pidstat -d -p 1622
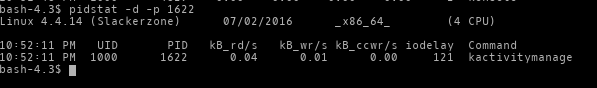
The IO output will display a few new columns:
kB_rd/s - Number of kilobytes the task has caused to be read from disk per second.
kB_wr/s - Number of kilobytes the task has caused, or shall cause to be written to disk per second.
kB_ccwr/s - Number of kilobytes whose writing to disk has been cancelled by the task.
Page Faults And Memory Usage
For see page faults and memory usage, use -r options like following command:
1
$ pidstat -d -p 1622
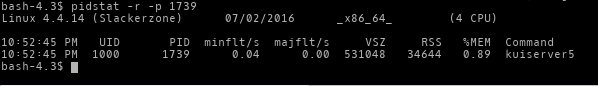
Important columns:
minflt/s - Total number of minor faults the task has made per second, those which have not required loading a memory page from disk.
majflt/s - Total number of major faults the task has made per second, those which have required loading a memory page from disk.
VSZ - Virtual Size: The virtual memory usage of entire task in kilobytes.
RSS - Resident Set Size: The non-swapped physical memory used by the task in kilobytes.
Using Pidstat To Find Memory Leak
You can use pidstat for find memory leak, like following command:
1
$ pidstat -r 2 5
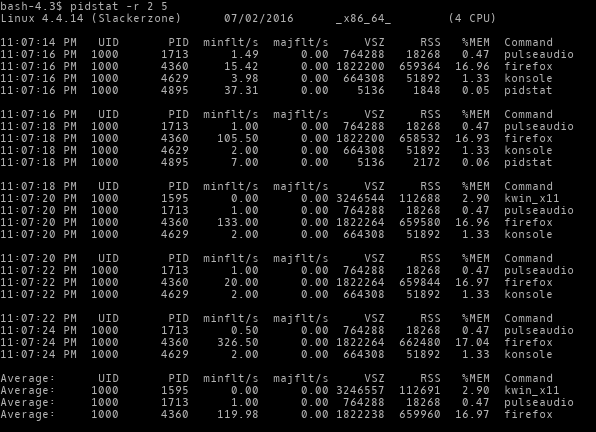
The options here use 2 and 5, will give your 5 reports one every 2 seconds.
Other option, you can use pidstat command for find children of running application like example:
1
$ pidstat -T CHILD -C ksmserver
or with combine all statistic in a single report:
1
$ pidstat -urd -h
Here this command using pidstat, you can develop with other options as your need. Thanks